Spectral data; selection of calibration model; tolerance intervals
Abstract :
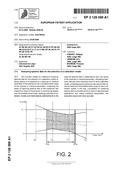
[en] The invention relates to a method of analyzing spectral data for the selection of a calibration model relating spectra of a substance to a physical or chemical parameter of the substance over a predetermined range
of the physical or chemical parameter, comprising the steps of capturing spectral data of the substance with
respective values of the physical or chemical parameter over the predetermined range, applying a plurality of calibration models and mathematical pretreatments to the captured spectral data in dependence upon the values of the physical or chemical parameter, calculating tolerance intervals and a reference level for each calibration model, and displaying the tolerance intervals and the reference level over the predetermined range for each calibration model. In this way, a possibility for analyzing spectra data is provided which is useful in spectroscopic applications and makes analytical interpretation and evaluation easier and more accurate.
Disciplines :
Pharmacy, pharmacology & toxicology
Inventor :
Ziemons, Eric ; Université de Liège - ULiège > Département de pharmacie > Chimie analytique
Moonen, François; Arlenda
Hubert, Philippe ; Université de Liège - ULiège > Département de pharmacie > Chimie analytique
Language :
English
Title (54) :
Analysing spectral data for the selection of a calibration model
Alternative titles :
[fr] Analyse de données spectrales pour la sélection d'un modèle d'étalonnage
Publication date (43-45) :
03 December 2009
Filing date (22) :
06 May 2009
Patent/publication number (10-11) :
WO 2009/144124 A1
Patent status (13) :
Pas de précision
Priority number (30) :
08157099.6 (EP)
International classification (IPC) (51) :
G01N 21/27; G01N 21/35
European classification (ECLA) (52) :
G01N 21/27 G01N 21/35
Applicant (71) :
Université de Liège, Arlenda S.A., Hubert Ph., Ziemons E., Moonen F.